This Content is powered by Balige Publishing. Visit this link
Different types are:

Below is the Python code demonstrating the five simple thresholding techniques:
Run image_threshold.py. You can see original image and five different resulting images as shown in figure below.

You can implement threshold on every individual color (every channel) of input image as follows:

Put one Table Widget and set its objectName property to twIntensity.
Save the form as image_thresh.ui. Now, the form looks as shown in figure below.


Tutorial Steps To Implement Image Thresholding
In this tutorial, you will learn simple thresholding and implement it with python GUI. If pixel value is greater than a threshold value, it is assigned one value, else it is assigned another value. The function used is cv2.threshold.
First argument is the source image, which should be a grayscale image or an image channel. Second argument is the threshold value which is used to classify the pixel values. Third argument is the maxVal which represents the value to be given if pixel value is more than (sometimes less than) the threshold value. OpenCV provides different styles of thresholding and it is decided by the fourth parameter of the function.

Below is the Python code demonstrating the five simple thresholding techniques:
1 2 3 4 5 6 7 8 9 10 11 12 13 14 15 16 17 18 19 20 21 22 23 24 25 26 27 28 29 30 31 32 | # image_threshold.py import cv2 import numpy as np # path to input image is specified and # image is loaded with imread command img = cv2.imread('Lenna256.png') # applying different thresholding # techniques on blue channel # all pixels value above 127 will # be set to 255 ret, thresh1 = cv2.threshold(img, 127, 255, cv2.THRESH_BINARY) ret, thresh2 = cv2.threshold(img, 127, 255, cv2.THRESH_BINARY_INV) ret, thresh3 = cv2.threshold(img, 127, 255, cv2.THRESH_TRUNC) ret, thresh4 = cv2.threshold(img, 127, 255, cv2.THRESH_TOZERO) ret, thresh5 = cv2.threshold(img, 127, 255, cv2.THRESH_TOZERO_INV) # the window showing output images # with the corresponding thresholding # techniques applied to the input images images = [img, thresh1, thresh2, thresh3, thresh4, thresh5] image_concat = np.concatenate(images[0:3],axis=1) image_concat2 = np.concatenate(images[3:6],axis=1) image_concat3 = np.concatenate((image_concat, image_concat2),axis=0) cv2.imshow('Image Thresholding',image_concat3) # De-allocate any associated memory usage if cv2.waitKey(0) & 0xff == 27: cv2.destroyAllWindows() |
Run image_threshold.py. You can see original image and five different resulting images as shown in figure below.

You can implement threshold on every individual color (every channel) of input image as follows:
1 2 3 4 5 6 7 8 9 10 11 12 13 14 15 16 17 18 19 20 21 22 23 24 25 26 27 28 29 30 31 32 33 34 35 36 37 38 39 40 41 42 43 44 45 46 47 48 49 50 51 | import cv2 import numpy as np # path to input image is specified and # image is loaded with imread command img = cv2.imread('Lenna.png') # splitting into individual colors b, g, r = cv2.split(img) # applying different thresholding # techniques on every channel # all pixels value above 127 will # be set to 255 ret, thresh1b = cv2.threshold(b, 127, 255, cv2.THRESH_BINARY) ret, thresh2b = cv2.threshold(b, 127, 255, cv2.THRESH_BINARY_INV) ret, thresh3b = cv2.threshold(b, 127, 255, cv2.THRESH_TRUNC) ret, thresh4b = cv2.threshold(b, 127, 255, cv2.THRESH_TOZERO) ret, thresh5b = cv2.threshold(b, 127, 255, cv2.THRESH_TOZERO_INV) ret, thresh1g = cv2.threshold(g, 127, 255, cv2.THRESH_BINARY) ret, thresh2g = cv2.threshold(g, 127, 255, cv2.THRESH_BINARY_INV) ret, thresh3g = cv2.threshold(g, 127, 255, cv2.THRESH_TRUNC) ret, thresh4g = cv2.threshold(g, 127, 255, cv2.THRESH_TOZERO) ret, thresh5g = cv2.threshold(g, 127, 255, cv2.THRESH_TOZERO_INV) ret, thresh1r = cv2.threshold(r, 127, 255, cv2.THRESH_BINARY) ret, thresh2r = cv2.threshold(r, 127, 255, cv2.THRESH_BINARY_INV) ret, thresh3r = cv2.threshold(r, 127, 255, cv2.THRESH_TRUNC) ret, thresh4r = cv2.threshold(r, 127, 255, cv2.THRESH_TOZERO) ret, thresh5r = cv2.threshold(r, 127, 255, cv2.THRESH_TOZERO_INV) # merging thresholded images img_merge_BIN = cv2.merge((thresh1b, thresh1g, thresh1r)) img_merge_BIN_INV = cv2.merge((thresh2b, thresh2g, thresh2r)) img_merge_BIN_TRUNC = cv2.merge((thresh3b, thresh3g, thresh3r)) img_merge_BIN_TOZERO = cv2.merge((thresh4b, thresh4g, thresh4r)) img_merge_BIN_TOZERO_INV = cv2.merge((thresh5b, thresh5g, thresh5r)) # the window showing output images # with the corresponding thresholding # techniques applied to the input images cv2.imshow('Binary Threshold', img_merge_BIN) cv2.imshow('Binary Threshold Inverted', img_merge_BIN_INV) cv2.imshow('Truncated Threshold', img_merge_BIN_TRUNC) cv2.imshow('Set to 0', img_merge_BIN_TOZERO) cv2.imshow('Set to 0 Inverted', img_merge_BIN_TOZERO_INV) # De-allocate any associated memory usage if cv2.waitKey(0) & 0xff == 27: cv2.destroyAllWindows() |
Next, you will implement the thresholding techniques with Python GUI. Open Qt Designer. Put two Label widgets dan one Push Button widget onto form. Set objectName property of the two Label widgets by name labelImage and labelThresh.
Set objectName property of the Push Button widgets to pbImage ans set its text property as Open Image. Set form’s name as image_thresh.ui.
Put two Widget from the Containers panel on the form. Set their objectName property to widgetHistIm and widgetHistThresh.
Then, put two Horizontal Slider widgets and set their objectName properties to hsMinVal and hsMaxVal. Set their minimum properties to 0 and 128 and their maximum properties to 127 and 255.
Put two Line Edit widgets on form and set their objectName properties to leMinVal and leMaxVal. Set their text properties to 0 and 255.
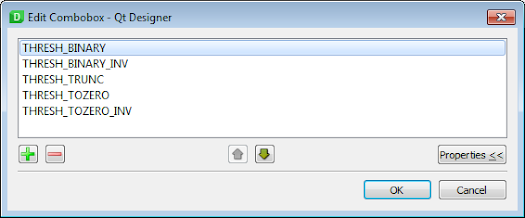
Put one Combo Box onto form and its objectName property to cboThresholding. Double click on this widget and populate it with five items as shown in figure below:

Put one List Widget and set its objectName property to lwChannel. Double click on this widget and populate it with three items as shown in figure below:

Put one Table Widget and set its objectName property to twIntensity.
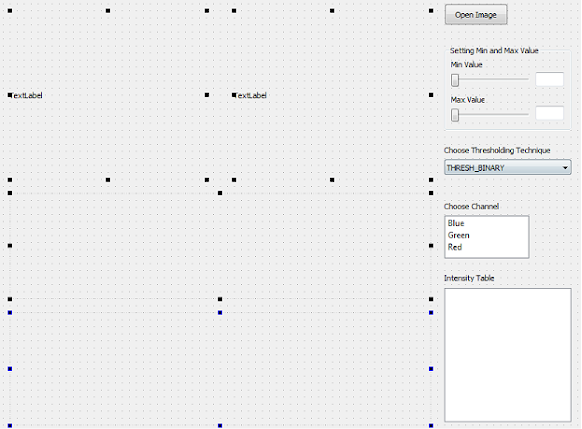
Save the form as image_thresh.ui. Now, the form looks as shown in figure below.

Next, right-click on the two Widget and from the context menu displayed select Promote to ... . Name the Promoted class name as Thresholding. Then click Add button and click the Promote button. In the Object Inspector window, you can see that widgetHistIm and widgetHistThresh (Thresholding class) along with other widgets are in the centralwidget object (QWidget class) as shown in figure below.

Define Thresholding class in a Python file ad save it as thresholding.py:
1 2 3 4 5 6 7 8 9 10 11 12 13 14 15 16 17 |
|
Write this Python script and set its name as to image_thresholding.py to open file dialog, display original image, and display its histogram:
1 2 3 4 5 6 7 8 9 10 11 12 13 14 15 16 17 18 19 20 21 22 23 24 25 26 27 28 29 30 31 32 33 34 35 36 37 38 39 40 41 42 43 44 45 46 47 48 49 50 51 52 53 54 55 56 57 58 59 60 61 62 63 64 65 66 67 68 69 70 71 72 73 74 75 76 |
|
Define a new method named setState() to set state’s application as follows:
1 2 3 4 5 6 7 8 9 10 11 12 13 14 15 16 17 |
|
Invoke setState() method from inside __init__() to disable widgets when form starts:
1 2 3 4 5 6 7 |
|
Invoke setState() from open_file() method to enable back the widgets when user click Open Image button as follows:
1 2 3 4 5 6 7 8 9 |
|
Run image_thresholding.py and click on Open Image. Make sure some widgets disabled when form first starts as shown in figure below.

Then open one image, then you will see the image and its histogram as shown in figure below. Makes sure the widgets enabled back.

Define two functions to display each slider handle value in Line Edit widget:
1 2 3 4 5 | def set_hsMinVal(self, value): self.leMinVal.setText(str(value)) def set_hsMaxVal(self, value): self.leMaxVal.setText(str(value)) |
Connect valueChanged event of hsMinVal widget with set_hsMinVal() method and valueChanged event of hsMaxVal widget with set_hsMaxVal(). Put them inside __init__() method:
1 2 3 4 5 6 7 8 9 |
|
Define the three new methods named do_thresh(), thresholding_tech(), and image_thresh() as follows:
1 2 3 4 5 6 7 8 9 10 11 12 13 14 15 16 17 18 19 20 21 22 23 24 25 26 27 28 29 30 31 32 33 34 35 36 37 38 39 40 41 42 43 44 45 46 47 48 49 |
|
Connect currentIndexChanged() of cboThresholding widget to image_thresh() and place it inside __init__() method as follows:
self.cboThresholding.currentIndexChanged.connect(self.image_thresh)
Modify set_hsMinVal() and set_hsMaxVal() to invoke image_thresh() as follows:
1 2 3 4 5 6 7 |
|
Connect textEdited() event of both leMinVal and leMaxVal widgets to image_thresh() and place them inside __init__() method as follows:
1 2 3 4 5 6 7 8 9 10 11 12 |
|
Run image_thresholding.py. Choose input image and you can choose minimum and maximum values for image thresholding using both horizontal sliders as shown in figure below.

Define a new method named channel_thresh() to choose image channel that needs thresholding as follows:
1 2 3 4 5 6 7 8 9 10 11 12 13 14 15 |
|
Connect clicked() signal of lwChannel widget with channel_thresh() method and put it inside __init__() method:
self.lwChannel.clicked.connect(self.channel_thresh)
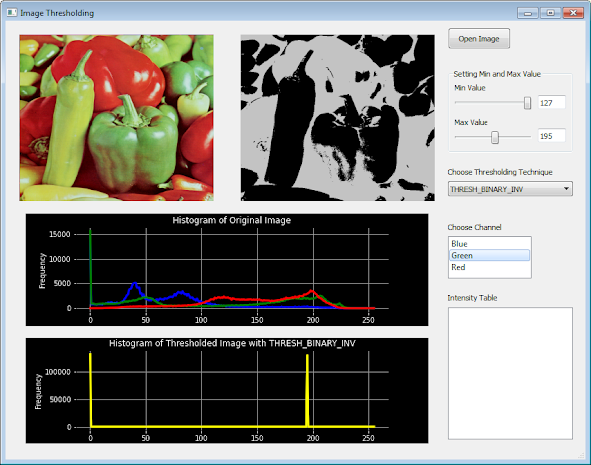
Run image_thresholding.py. Open an image and choose minimum and maximum threshold values. You can choose different thresholding technique. Then choose one of image channels from lwChannel and you can see thresholded image channel and its histogram as shown in figure below.

Modify channel_thresh() and define populate_table() method to populate twIntensity widget with image intensities of chosen channel from lwChannel as follows:
def channel_thresh(self):img = cv2.imread(fname[0], cv2.IMREAD_COLOR)# splitting into individual colorsb, g, r = cv2.split(img)item = self.lwChannel.currentItem()channel = item.text()if channel == 'Blue':self.thresholding_tech(b)self.labelTableTitle.setText(\'Image intensities of '+channel+' channel')self.populate_table(b)if channel == 'Green':self.labelTableTitle.setText(\'Image intensities of '+channel+' channel')self.thresholding_tech(g)if channel == 'Red':self.labelTableTitle.setText(\'Image intensities of '+channel+' channel')self.thresholding_tech(r)def populate_table(self, matrix):self.twIntensity.setRowCount(len(matrix))self.twIntensity.setColumnCount(len(matrix[0]))for i,row in enumerate(matrix):for j,val in enumerate(row):self.twIntensity.setItem(i,j,QTableWidgetItem(str(val)))
Run image_thresholding.py. Open an image and choose minimum and maximum threshold values. You can choose different thresholding technique. Then choose one of image channels from lwChannel and you can see thresholded image channel and its histogram. In twIntensity widget, you now can see the image intensities of the chosen channel from lwChannel widget as shown in figure below.

Hi vivian,
ReplyDeleteHope you are dong well. I am a student and i tried your code but I dont know it not working due to the display_image function you have used. its not even displaying the original image and its histogram.
The bug is at this command
self.display_image(pixmap, img, self.labelImage, \
self.widgetHistIm, 'Histogram of Original Image')
Can you tell about this ?