To know more about Python GUI and MySQL database, you can purchase my book (indonesian version) titled "LANGKAH DEMI LANGKAH| MEMBANGUN SISTEM MANAJEMEN DATABASE DENGAN PYTHON/MYSQL" on Google Play Books.
In this tutorial, you will use five CheckBox widget from Qt Designer to perform kernel filters with different size. The resulting image and its histogram will be displayed. Follow these steps below:
In this tutorial, you will use five CheckBox widget from Qt Designer to perform kernel filters with different size. The resulting image and its histogram will be displayed. Follow these steps below:
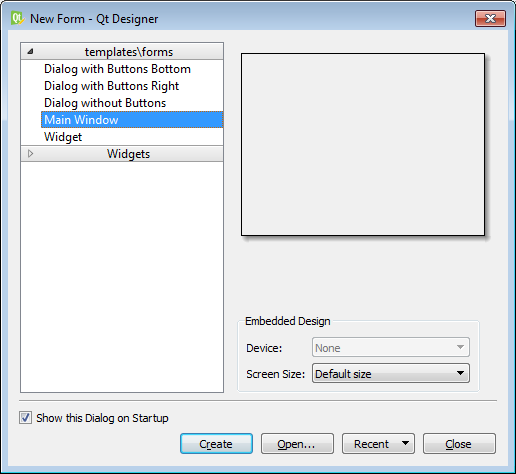
- Open Qt Designer. Create the form using the Main Window template:
- Click the Create button.
- Then, place a Push Button widget and two Label widgets on the form.
- Specify the text property of the Push Button widget to Read Image dan that of two Label widget to labelImage and labelFilter in the Property Editor window.
- Set the property of the objectName from the Push Button widget in the Property Editor window to pbImage.
- Place two Widget widgets from the Containers panel on the form. Set the objectName property of the two Widget to be the widgetDisplay and widgetDisplay2.
- Place five CheckBox widgets onto form. Specify the text property of each CheckBox widget to Kernel 3 x 3, Kernel 5 x 5, Kernel 7 x 7, Kernel 9 x 9, and Kernel 11 x 11.
- Set the objectName property of each CheckBox widget to cbKernel3x3, cbKernel5x5, cbKernel7x7, cbKernel9x9, and cbKernel11x11.
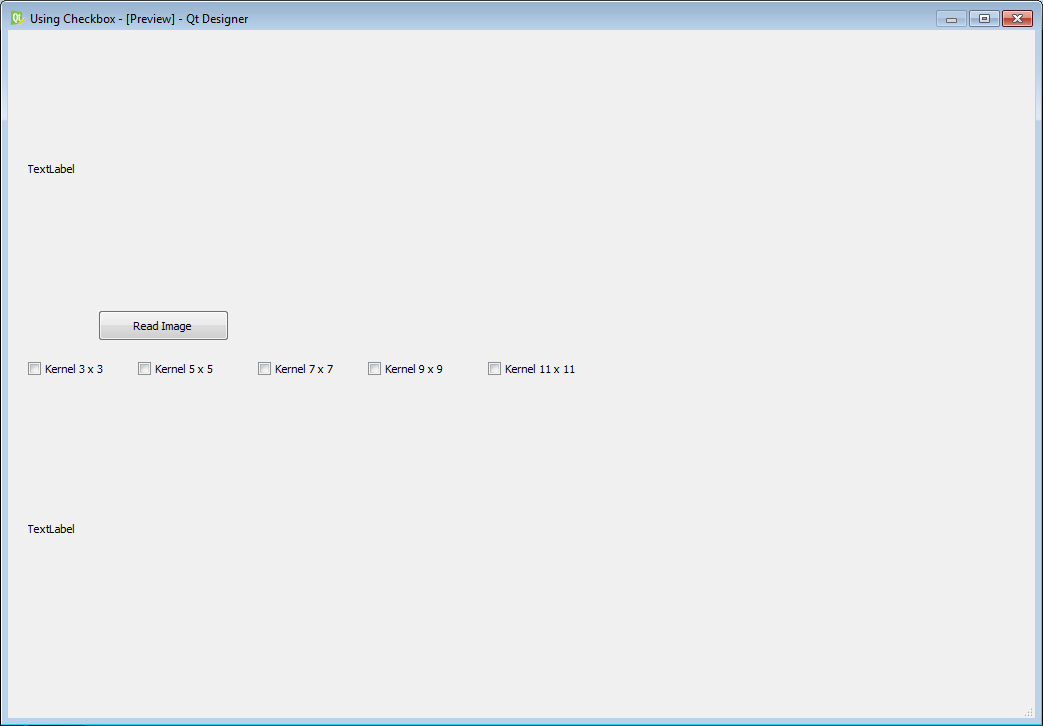
- Save the form with the name histogram2.ui. Now, the form looks like it looks in the following figure:
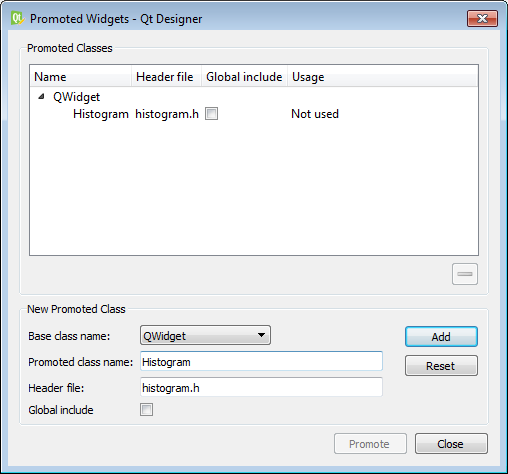
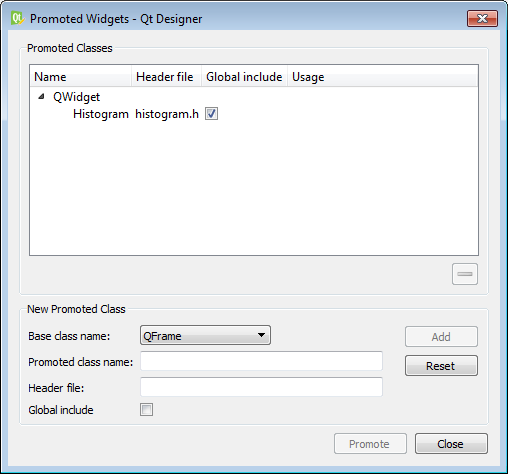
- Next, right-click on the two Widget and from the context menu displayed select Promoted widgets and select checkbox available (as before, Histogram).
- Define the Histogram class in a Python file with the same name as before:
- Define the new Python script with name main_histogram2.py that defines five methods relating to kernel filtering and connect it with the stateChanged() event from corresponding CheckBox widget:
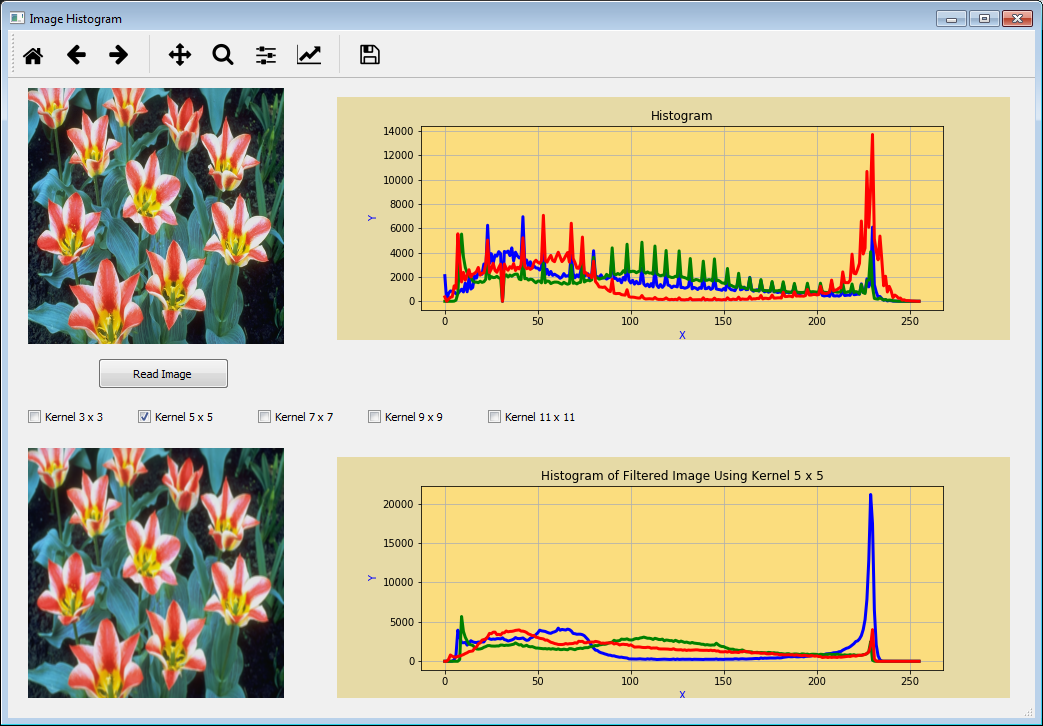
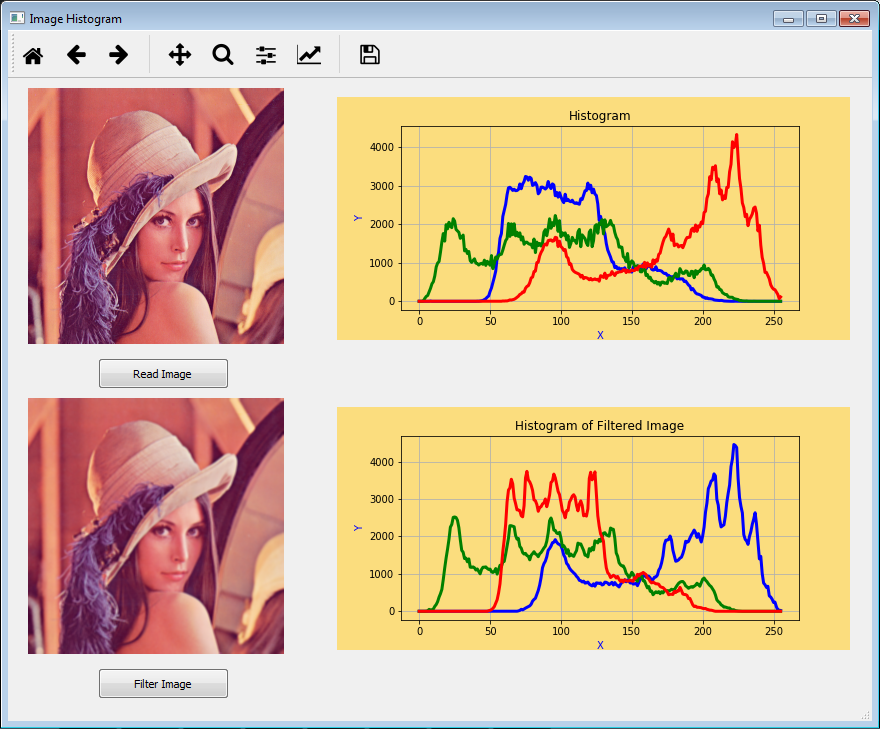
- Click on Read Image and select one of five checkboxes available. You now can see the filtered image and its each histogram:
from PyQt5.QtWidgets import*
from matplotlib.backends.backend_qt5agg import FigureCanvas
from matplotlib.figure import Figure

class Histogram(QWidget):
    def __init__(self, parent = None):
        QWidget.__init__(self, parent)
        self.canvas = FigureCanvas(Figure())

        vertical_layout = QVBoxLayout()
        vertical_layout.addWidget(self.canvas)

        self.canvas.axes1 = self.canvas.figure.add_subplot(111)
        self.canvas.figure.set_facecolor("xkcd:beige")
        self.setLayout(vertical_layout)
#main_histogram2.py
import cv2
import numpy as np
from PyQt5.QtWidgets import*
from PyQt5.uic import loadUi
from matplotlib.backends.backend_qt5agg import (NavigationToolbar2QT as NavigationToolbar)
from PyQt5.QtWidgets import QDialog, QFileDialog
from PyQt5.QtGui import QIcon, QPixmap, QImage

import numpy as np
fname = ""

class Display_Histogram(QMainWindow):
    def __init__(self):
        QMainWindow.__init__(self)
        loadUi("histogram2.ui",self)

        self.setWindowTitle("Image Histogram")
        self.pbImage.clicked.connect(self.display_histogram)
        self.cbKernel3x3.stateChanged.connect(lambda:self.btnstate(self.cbKernel3x3))
        self.cbKernel5x5.stateChanged.connect(lambda:self.btnstate(self.cbKernel5x5))
        self.cbKernel7x7.stateChanged.connect(lambda:self.btnstate(self.cbKernel7x7))
        self.cbKernel9x9.stateChanged.connect(lambda:self.btnstate(self.cbKernel9x9))
        self.cbKernel11x11.stateChanged.connect(lambda:self.btnstate(self.cbKernel11x11))
        self.addToolBar(NavigationToolbar(self.widgetDisplay.canvas, self))

    def display_histogram(self):
        global fname
        fname = QFileDialog.getOpenFileName(self, 'Open file',
           'd:\\',"Image Files (*.jpg *.gif *.bmp *.png *.tiff)")
        pixmap = QPixmap(fname[0])
        self.labelImage.setPixmap(pixmap)
        self.labelImage.setScaledContents(True);


        self.widgetDisplay.canvas.axes1.clear()
        read_img = cv2.imread(fname[0], cv2.IMREAD_COLOR)
        color = ('b','g','r')
        for i,col in enumerate(color):
            histr = cv2.calcHist([read_img],[i],None,[256],[0,256])
            self.widgetDisplay.canvas.axes1.plot(histr,color = col,linewidth=3.0)
            self.widgetDisplay.canvas.axes1.set_ylabel('Y', color='blue')
            self.widgetDisplay.canvas.axes1.set_xlabel('X', color='blue')
            self.widgetDisplay.canvas.axes1.set_title('Histogram')
            self.widgetDisplay.canvas.axes1.set_facecolor('xkcd:wheat')
            self.widgetDisplay.canvas.axes1.grid()
        self.widgetDisplay.canvas.draw()

    def kernel3x3(self):
        read_img = cv2.imread(fname[0], cv2.IMREAD_COLOR)

        # To filter image using kernel 3x3
        kernel_3x3 = np.ones((3,3), np.float32) / 9.0
        self.output = cv2.filter2D(read_img, -1, kernel_3x3)

        return self.output

    def kernel5x5(self):
        read_img = cv2.imread(fname[0], cv2.IMREAD_COLOR)

        # To filter image using kernel 5x5
        kernel_5x5 = np.ones((5,5), np.float32) / 25.0
        self.output = cv2.filter2D(read_img, -1, kernel_5x5)

        return self.output

    def kernel7x7(self):
        read_img = cv2.imread(fname[0], cv2.IMREAD_COLOR)

        # To filter image using kernel 7x7
        kernel_7x7 = np.ones((7,7), np.float32) / 49.0
        self.output = cv2.filter2D(read_img, -1, kernel_7x7)

        return self.output

    def kernel9x9(self):
        read_img = cv2.imread(fname[0], cv2.IMREAD_COLOR)

        # To filter image using kernel 9x9
        kernel_9x9 = np.ones((9,9), np.float32) / 81.0
        self.output = cv2.filter2D(read_img, -1, kernel_9x9)

        return self.output

    def kernel11x11(self):
        read_img = cv2.imread(fname[0], cv2.IMREAD_COLOR)

        # To filter image using kernel 11x11
        kernel_11x11 = np.ones((11,11), np.float32) / 121.0
        self.output = cv2.filter2D(read_img, -1, kernel_11x11)

        return self.output

    def display_output(self, output, title):
        # To convert back from BGR to RGB space color
        cv2.cvtColor(output, cv2.COLOR_BGR2RGB, output)

        # To display image in label widget
        height, width, channel = output.shape
        bytesPerLine = 3 * width
        qImg = QImage(output.data, width, height, bytesPerLine, QImage.Format_RGB888)
        pixmap = QPixmap.fromImage(qImg)
        self.labelFilter.setPixmap(pixmap)
        self.labelFilter.setScaledContents(True);

        self.widgetDisplay2.canvas.axes1.clear()
        color = ('b','g','r')
        for i,col in enumerate(color):
            histr = cv2.calcHist([output],[i],None,[256],[0,256])
            self.widgetDisplay2.canvas.axes1.plot(histr,color = col,linewidth=3.0)
            self.widgetDisplay2.canvas.axes1.set_ylabel('Y', color='blue')
            self.widgetDisplay2.canvas.axes1.set_xlabel('X', color='blue')
            self.widgetDisplay2.canvas.axes1.set_title(title)
            self.widgetDisplay2.canvas.axes1.set_facecolor('xkcd:wheat')
            self.widgetDisplay2.canvas.axes1.grid()
        self.widgetDisplay2.canvas.draw()

    def btnstate(self,b):
        if b.text() == "Kernel 3 x 3":
            if b.isChecked() == True:
                self.cbKernel5x5.setChecked(False)
                self.cbKernel7x7.setChecked(False)
                self.cbKernel9x9.setChecked(False)
                self.cbKernel11x11.setChecked(False)
                self.output = self.kernel3x3()
                self.display_output(self.output, 'Histogram of Filtered Image Using Kernel 3 x 3')
            else:
                print b.text()+" is deselected"

        if b.text() == "Kernel 5 x 5":
            if b.isChecked() == True:
                self.cbKernel3x3.setChecked(False)
                self.cbKernel7x7.setChecked(False)
                self.cbKernel9x9.setChecked(False)
                self.cbKernel11x11.setChecked(False)
                self.output = self.kernel5x5()
                self.display_output(self.output, 'Histogram of Filtered Image Using Kernel 5 x 5')
            else:
                print b.text()+" is deselected"

        if b.text() == "Kernel 7 x 7":
            if b.isChecked() == True:
                self.cbKernel3x3.setChecked(False)
                self.cbKernel5x5.setChecked(False)
                self.cbKernel9x9.setChecked(False)
                self.cbKernel11x11.setChecked(False)
                self.output = self.kernel7x7()
                self.display_output(self.output, 'Histogram of Filtered Image Using Kernel 7 x 7')
            else:
                print b.text()+" is deselected"

        if b.text() == "Kernel 9 x 9":
            if b.isChecked() == True:
                self.cbKernel3x3.setChecked(False)
                self.cbKernel7x7.setChecked(False)
                self.cbKernel5x5.setChecked(False)
                self.cbKernel11x11.setChecked(False)
                self.output = self.kernel9x9()
                self.display_output(self.output, 'Histogram of Filtered Image Using Kernel 9 x 9')
            else:
                print b.text()+" is deselected"

        if b.text() == "Kernel 11 x 11":
            if b.isChecked() == True:
                self.cbKernel3x3.setChecked(False)
                self.cbKernel7x7.setChecked(False)
                self.cbKernel9x9.setChecked(False)
                self.cbKernel5x5.setChecked(False)
                self.output = self.kernel11x11()
                self.display_output(self.output, 'Histogram of Filtered Image Using Kernel 11 x 11')
            else:
                print b.text()+" is deselected"

if __name__ == '__main__':
    import sys
    app = QApplication(sys.argv)
    ex = Display_Histogram()
    ex.show()
    sys.exit(app.exec_())