This Content is supported by BALIGE PUBLISHING. Visit this link
Tutorial Steps To Calculate Fast Fourier Transform
Following is the Python script to calculate Fast Fourier Transform (FFT) on sinc() function:


Define a new Python script and set ist name as main_fft.py that defines the method show_graph() and connect it with clicked() event of pbShow widget:
Run the program and click SHOW button. You can change signal range to see what happens as shown in figure below.


Tutorial Steps To Calculate Fast Fourier Transform
Following is the Python script to calculate Fast Fourier Transform (FFT) on sinc() function:
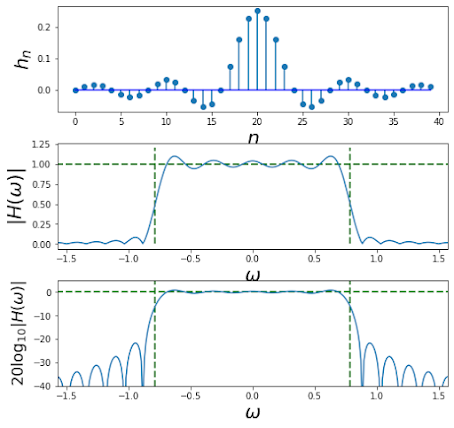
#calc_fft.py
from scipy import signal
from numpy import *
import matplotlib.pyplot as plt

wc = pi/4
M=20
N = 512 # DFT size
n = arange(-M,M)
h = wc/pi * sinc(wc*(n)/pi) # see definition of np.sinc()

w,Hh = signal.freqz(h,1,whole=True, worN=N) # get entire frequency domain
wx = fft.fftfreq(len(w)) # shift to center for plotting

fig,axs = plt.subplots(3,1)
fig.set_size_inches((8,8))
plt.subplots_adjust(hspace=0.3)
ax=axs[0]
ax.stem(n+M,h,basefmt='b-')
ax.set_xlabel("$n$",fontsize=22)
ax.set_ylabel("$h_n$",fontsize=22)

ax=axs[1]
ax.plot(w-pi,abs(fft.fftshift(Hh)))
ax.axis(xmax=pi/2,xmin=-pi/2)
ax.vlines([-wc,wc],0,1.2,color='g',lw=2.,linestyle='--',)
ax.hlines(1,-pi,pi,color='g',lw=2.,linestyle='--',)
ax.set_xlabel(r"$\omega$",fontsize=22)
ax.set_ylabel(r"$|H(\omega)| $",fontsize=22)

ax=axs[2]
ax.plot(w-pi,20*log10(abs(fft.fftshift(Hh))))
ax.axis(ymin=-40,xmax=pi/2,xmin=-pi/2)
ax.vlines([-wc,wc],10,-40,color='g',lw=2.,linestyle='--',)
ax.hlines(0,-pi,pi,color='g',lw=2.,linestyle='--',)
ax.set_xlabel(r"$\omega$",fontsize=22)
ax.set_ylabel(r"$20\log_{10}|H(\omega)| $",fontsize=18)
Run the script. You will see three graphs (impulse response, magnitude frequency response, and log magnitude frequency response), which is the FFT on sinc function, as shown in figure below.

Tutorial Steps To Create GUI For FFT
Now, you can build GUI for this FFT. Open Qt Designer. Create the form using the Main Window template.

Click the Create button. Then, place a Push Button widget on the form. Specify the text property of the Push Button widget in the Property Editor window to SHOW. Set the property of the objectName of Push Button widget in the Property Editor window to pbShow.
Place three Widgets from the Containers panel on the form. Set their objectName properties to widgetSignal, widgetFFTAbs, and widgetFFTLog.
Add three Label widgets on the form. Set their text properties to Cut-off freq, FFT Length, and Signal Range. Set their objectName properties to leCutOff, leFFTLength, and leSignalRange.
Save the form as gui_fft.ui. Now, the form looks as shown in figure above.
Next, right-click on the three Widgets and from the context menu displayed select Promote to .... Set the Promoted class name as gui_fft. Then click the Add button and click the Promote button.
In the Object Inspector window, you can see that widgetShow (gui_fft class) along with the pbShow object (QPushButton class) is now in the centralwidget object (QWidget class) as shown in figure below.

Define gui_fft class (according to the class name of the three Widgets) in a Python file. Save it as gui_fft.py:
#gui_fft.py

from PyQt5.QtWidgets import*
from matplotlib.backends.backend_qt5agg import FigureCanvas
from matplotlib.figure import Figure

class gui_fft(QWidget):
    def __init__(self, parent = None):
        QWidget.__init__(self, parent)
        self.canvas = FigureCanvas(Figure())

        vertical_layout = QVBoxLayout()
        vertical_layout.addWidget(self.canvas)

        self.canvas.axis1 = self.canvas.figure.add_subplot(111)
        self.canvas.figure.set_facecolor("lightblue")
        self.setLayout(vertical_layout)
Define a new Python script and set ist name as main_fft.py that defines the method show_graph() and connect it with clicked() event of pbShow widget:
#main_fft.py

from PyQt5.QtWidgets import *
from PyQt5.uic import loadUi
from matplotlib.backends.backend_qt5agg import (NavigationToolbar2QT as NavigationToolbar)

import numpy as np
from scipy import signal
from numpy import *
import matplotlib as mpl

class DemoGUIFFT(QMainWindow):
    def __init__(self):

        QMainWindow.__init__(self)
        loadUi("gui_fft.ui",self)

        self.setWindowTitle("GUI Demo for FFT")
        self.pbShow.clicked.connect(self.show_graph)
        self.addToolBar(NavigationToolbar(self.widgetSignal.canvas, self))

    def show_graph(self):
        wc = float(self.leCutOff.text())
        N = int(self.leFFTLength.text())
        M = int(self.leSignalRange.text())
        wc = wc*pi

        # widgetSignal
        n = arange(-M, M)
        h = wc/pi * sinc(wc*(n)/pi)
        mpl.style.use('seaborn')
        self.widgetSignal.canvas.axis1.clear()
        self.widgetSignal.canvas.axis1.stem(n,h,\
            basefmt='r-',use_line_collection=True)
        self.widgetSignal.canvas.axis1.annotate('$n$', \
            xy=(0.98, 0), ha='left', va='top', \
            xycoords='axes fraction', fontsize=20)
        self.widgetSignal.canvas.axis1.annotate('$h$', \
            xy=(0, 1), xytext=(-15,5), ha='left', va='top', \
            xycoords='axes fraction', textcoords='offset points', \
            fontsize=20)
        self.widgetSignal.canvas.axis1.set_title('Stem Graph')
        self.widgetSignal.canvas.axis1.set_facecolor('lightblue')
        self.widgetSignal.canvas.axis1.grid()
        self.widgetSignal.canvas.draw()

if __name__ == '__main__':
    import sys
    app = QApplication(sys.argv)
    ex = DemoGUIFFT()
    ex.show()
    sys.exit(app.exec_())
Run the program and click SHOW button. You can change signal range to see what happens as shown in figure below.

Modify main_fft.py to calculate and display FFT on sinc signal as follows:
#main_fft.py

from PyQt5.QtWidgets import *
from PyQt5.uic import loadUi
from matplotlib.backends.backend_qt5agg import (NavigationToolbar2QT as NavigationToolbar)

import numpy as np
from scipy import signal
from numpy import *
import matplotlib as mpl

class DemoGUIFFT(QMainWindow):
    def __init__(self):

        QMainWindow.__init__(self)
        loadUi("gui_fft.ui",self)

        self.setWindowTitle("GUI Demo for FFT")
        self.pbShow.clicked.connect(self.show_graph)
        self.addToolBar(NavigationToolbar(self.widgetSignal.canvas, self))

    def show_graph(self):
        wc = float(self.leCutOff.text())
        N = int(self.leFFTLength.text())
        M = int(self.leSignalRange.text())
        wc = wc*pi

        # widgetSignal
        n = arange(-M, M)
        h = wc/pi * sinc(wc*(n)/pi)
        mpl.style.use('seaborn')
        self.widgetSignal.canvas.axis1.clear()
        self.widgetSignal.canvas.axis1.stem(n,h,\
            basefmt='r-',use_line_collection=True)
        self.widgetSignal.canvas.axis1.annotate('$n$', xy=(0.98, 0), \
            ha='left', va='top', xycoords='axes fraction', \
            fontsize=20)
        self.widgetSignal.canvas.axis1.annotate('$h$', xy=(0, 1), \
            xytext=(-15,5), ha='left', va='top', \
            xycoords='axes fraction', textcoords='offset points', \
            fontsize=20)
        self.widgetSignal.canvas.axis1.set_title('Stem Graph')
        self.widgetSignal.canvas.axis1.set_facecolor('lightblue')
        self.widgetSignal.canvas.axis1.grid()
        self.widgetSignal.canvas.draw()
        self.show_fft(h)

    def show_fft(self, h):
        wc = float(self.leCutOff.text())
        N = int(self.leFFTLength.text())
        M = int(self.leSignalRange.text())
        wc = wc*pi

        # widgetFFTAbs
        # get entire frequency domain
        w,Hh = signal.freqz(h,1,whole=True, worN=N)
        wx = fft.fftfreq(len(w))    # shift to center for plotting

        self.widgetFFTAbs.canvas.axis1.clear()
        self.widgetFFTAbs.canvas.axis1.plot(w-pi,\
            abs(fft.fftshift(Hh)), color='red', linewidth=3.0)
        self.widgetFFTAbs.canvas.axis1.axis(xmax=pi/2,xmin=-pi/2)
        self.widgetFFTAbs.canvas.axis1.vlines([-1.1,1.1],\
            0,1.2,color='g',lw=2.,linestyle='--',)
        self.widgetFFTAbs.canvas.axis1.hlines(1,\
            -pi,pi,color='g',lw=2.,linestyle='--',)
        self.widgetFFTAbs.canvas.axis1.annotate(r'$\omega$',\
            xy=(0.98, 0), ha='left', va='top', \
            xycoords='axes fraction', fontsize=22)
        self.widgetFFTAbs.canvas.axis1.set_ylabel(r"$|H(\omega)| $",\
            fontsize=22)
        self.widgetFFTAbs.canvas.axis1.set_title('Absolute FFT Graph')
        self.widgetFFTAbs.canvas.axis1.set_facecolor('lightblue')
        self.widgetFFTAbs.canvas.axis1.grid()
        self.widgetFFTAbs.canvas.draw()

        # widgetFFTLog
        # get entire frequency domain
        w,Hh = signal.freqz(h,1,whole=True, worN=N)
        wx = fft.fftfreq(len(w))    # shift to center for plotting

        self.widgetFFTLog.canvas.axis1.clear()
        self.widgetFFTLog.canvas.axis1.plot(w-pi,\
            20*log10(abs(fft.fftshift(Hh))),color='red', \
            linewidth=3.0)
        self.widgetFFTLog.canvas.axis1.axis(ymin=-60,\
            xmax=pi/2,xmin=-pi/2)
        self.widgetFFTLog.canvas.axis1.vlines([-wc,wc],10,\
            -40,color='g',lw=2.,linestyle='--',)
        self.widgetFFTLog.canvas.axis1.hlines(0,\
            -pi,pi,color='g',lw=2.,linestyle='--',)
        self.widgetFFTLog.canvas.axis1.annotate(r'$\omega$', \
            xy=(0.98, 0), ha='left', va='top', \
            xycoords='axes fraction', fontsize=22)
        self.widgetFFTLog.canvas.axis1.set_ylabel(\
            r"$20\log_{10}|H(\omega)| $",fontsize=18)
        self.widgetFFTLog.canvas.axis1.set_title('Log Absolute FFT Graph')
        self.widgetFFTLog.canvas.axis1.set_facecolor('lightblue')
        self.widgetFFTLog.canvas.axis1.grid()
        self.widgetFFTLog.canvas.draw()

if __name__ == '__main__':
    import sys
    app = QApplication(sys.argv)
    ex = DemoGUIFFT()
    ex.show()
    sys.exit(app.exec_())
Run the program and click SHOW button. Change signal range to see the absolute frequency response and magnitude frequency response as shown in below.

Tutorial Steps To Create GUI For FFT With Some Other Input Signals
In gui_fft.ui, add one Radio Button widget on the form. Set its text property to Chirp and its objectName to rbChirp.
Add four Label widgets on the form. Set their text properties to x start, x end, f start, and f end. Set their objectName properties to leXStart, leXEnd, leFStart, leFEnd. The modified fft_gui.ui is shown in figure below.

Modify main_fft.py as follows:
#main_fft.py

from PyQt5.QtWidgets import *
from PyQt5.uic import loadUi
from matplotlib.backends.backend_qt5agg import (NavigationToolbar2QT as NavigationToolbar)

import numpy as np
from scipy import signal
from numpy import *
import matplotlib as mpl
from scipy.signal import chirp

class DemoGUIFFT(QMainWindow):
    def __init__(self):

        QMainWindow.__init__(self)
        loadUi("gui_fft.ui",self)

        self.setWindowTitle("GUI Demo for FFT")
        self.pbShow.clicked.connect(self.show_graph)
        self.addToolBar(NavigationToolbar(self.widgetSignal.canvas, self))
        self.rbChirp.toggled.connect(self.show_chirp)

    def show_graph(self):
        wc = float(self.leCutOff.text())
        N = int(self.leFFTLength.text())
        M = int(self.leSignalRange.text())
        wc = wc*pi

        # widgetSignal
        n = arange(-M, M)
        h = wc/pi * sinc(wc*(n)/pi)
        mpl.style.use('seaborn')
        self.widgetSignal.canvas.axis1.clear()
        self.widgetSignal.canvas.axis1.stem(n,h,\
            basefmt='r-',use_line_collection=True)
        self.widgetSignal.canvas.axis1.annotate('$n$', xy=(0.98, 0), \
            ha='left', va='top', xycoords='axes fraction', \
            fontsize=20)
        self.widgetSignal.canvas.axis1.annotate('$h$', xy=(0, 1), \
            xytext=(-15,5), ha='left', va='top', \
            xycoords='axes fraction', textcoords='offset points', \
            fontsize=20)
        self.widgetSignal.canvas.axis1.set_title('Stem Graph')
        self.widgetSignal.canvas.axis1.set_facecolor('lightblue')
        self.widgetSignal.canvas.axis1.grid()
        self.widgetSignal.canvas.draw()
        self.show_fft(h)

    def show_fft(self, h):
        wc = float(self.leCutOff.text())
        N = int(self.leFFTLength.text())
        M = int(self.leSignalRange.text())
        wc = wc*pi

        # widgetFFTAbs
        # get entire frequency domain
        w,Hh = signal.freqz(h,1,whole=True, worN=N)
        wx = fft.fftfreq(len(w))    # shift to center for plotting

        self.widgetFFTAbs.canvas.axis1.clear()
        self.widgetFFTAbs.canvas.axis1.plot(w-pi,\
            abs(fft.fftshift(Hh)), color='red', linewidth=3.0)
        self.widgetFFTAbs.canvas.axis1.axis(xmax=pi/2,xmin=-pi/2)
        self.widgetFFTAbs.canvas.axis1.vlines([-1.1,1.1],\
            0,1.2,color='g',lw=2.,linestyle='--',)
        self.widgetFFTAbs.canvas.axis1.hlines(1,\
            -pi,pi,color='g',lw=2.,linestyle='--',)
        self.widgetFFTAbs.canvas.axis1.annotate(r'$\omega$',\
            xy=(0.98, 0), ha='left', va='top', \
            xycoords='axes fraction', fontsize=22)
        self.widgetFFTAbs.canvas.axis1.set_ylabel(r"$|H(\omega)| $",\
            fontsize=22)
        self.widgetFFTAbs.canvas.axis1.set_title('Absolute FFT Graph')
        self.widgetFFTAbs.canvas.axis1.set_facecolor('lightblue')
        self.widgetFFTAbs.canvas.axis1.grid()
        self.widgetFFTAbs.canvas.draw()

        # widgetFFTLog
        # get entire frequency domain
        w,Hh = signal.freqz(h,1,whole=True, worN=N)
        wx = fft.fftfreq(len(w))    # shift to center for plotting

        self.widgetFFTLog.canvas.axis1.clear()
        self.widgetFFTLog.canvas.axis1.plot(w-pi,\
            20*log10(abs(fft.fftshift(Hh))),color='red', \
            linewidth=3.0)
        self.widgetFFTLog.canvas.axis1.axis(ymin=-60,\
            xmax=pi/2,xmin=-pi/2)
        self.widgetFFTLog.canvas.axis1.vlines([-wc,wc],10,\
            -40,color='g',lw=2.,linestyle='--',)
        self.widgetFFTLog.canvas.axis1.hlines(0,\
            -pi,pi,color='g',lw=2.,linestyle='--',)
        self.widgetFFTLog.canvas.axis1.annotate(r'$\omega$', \
            xy=(0.98, 0), ha='left', va='top', \
            xycoords='axes fraction', fontsize=22)
        self.widgetFFTLog.canvas.axis1.set_ylabel(\
            r"$20\log_{10}|H(\omega)| $",fontsize=18)
        self.widgetFFTLog.canvas.axis1.set_title('Log Absolute FFT Graph')
        self.widgetFFTLog.canvas.axis1.set_facecolor('lightblue')
        self.widgetFFTLog.canvas.axis1.grid()
        self.widgetFFTLog.canvas.draw()

    def show_chirp(self):
        x_start = float(self.leXStart.text())
        x_end = float(self.leXEnd.text())
        f_start = float(self.leFStart.text())
        f_end = float(self.leFEnd.text())

        # widgetSignal
        t = linspace(x_start, x_end, 5001)
        w = chirp(t, f0=f_start, f1=f_end, t1=10, method='linear')

        self.widgetSignal.canvas.axis1.clear()
        #self.widgetSignal.canvas.axis1.plot(t, w)
        self.widgetSignal.canvas.axis1.plot(t,w,linewidth=3.0)
        self.widgetSignal.canvas.axis1.annotate('$sec$', xy=(0.98, 0), \
            ha='left', va='top', xycoords='axes fraction', fontsize=20)
        self.widgetSignal.canvas.axis1.annotate('$h$', xy=(0, 1), \
            xytext=(-15,5), ha='left', va='top', \
            xycoords='axes fraction', textcoords='offset points', \
            fontsize=20)
        self.widgetSignal.canvas.axis1.set_title('Chirp Graph')
        self.widgetSignal.canvas.axis1.set_facecolor('lightblue')
        self.widgetSignal.canvas.axis1.grid()
        self.widgetSignal.canvas.draw()

        self.show_fft(w)

if __name__ == '__main__':
    import sys
    app = QApplication(sys.argv)
    ex = DemoGUIFFT()
    ex.show()
    sys.exit(app.exec_())
Run the program and click on the radio button to see chirp signal and its Fourier transform as shown in figure below.

Hi where we need to add gui_fft.h file, what we need to write in gui_fft.h file
ReplyDeletewhere is the gui_fft.h file
ReplyDelete